What a day! I’m currently heading North in a cramped East coast carriage from #thatLondon happy as Larry (no, I’m not sure who he is either). To see a Jisc project deliver, and deliver emphatically is beyond joyous; and Myles, Janette, Lee and the rest of the gang should be so proud of what they’ve achieved. Along with HESA and HESPA we have developed a Business Intelligence environment — Heidi Lab — that has allowed a wide range of UK Universities to work together to develop a range of top quality dashboards that are pretty much ready for use, helping to inform strategic decision-making.
What is Heidi Lab?
Universities are regulated by and receive funding from UK government. To help with that, higher education providers are required to submit a range of data sets e.g. on their students, staff, finances and estate. This data is also useful for a whole range of other purposes such as strategic decision-making, research and transparency. The data is collected and managed by the Higher Education Statistics Agency (HESA) and stored in the Higher Education Information Database for Institutions (HEIDI). Don’t you just love acronyms?
The long standing problem, however, is that the data is particularly difficult to access and turn into something meaningful. Trust me, I tried for my MSc! In collaboration with HESA, and input from the sector, Jisc aimed to resolve this whilst providing access to a wider range of data sets to answer questions pertinent to the sector as a whole. And so, the Business Intelligence project was born.
The project itself had two distinct parts:
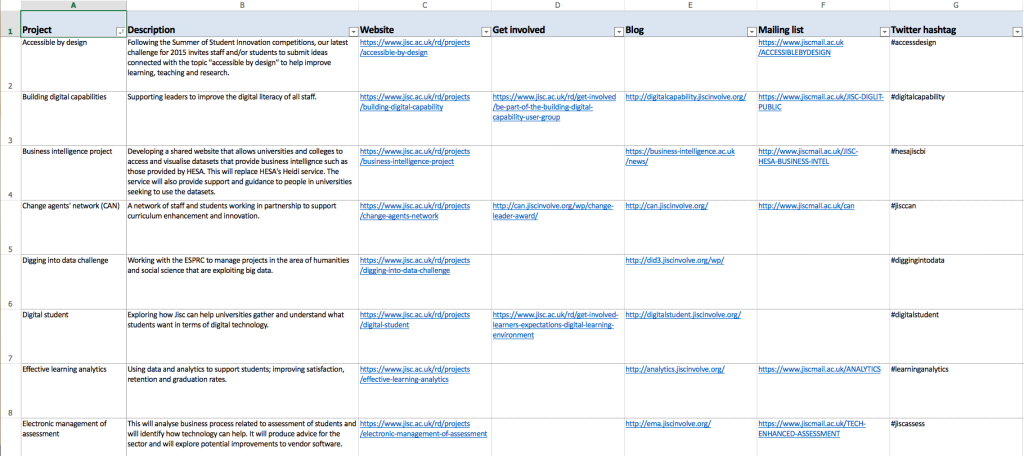
- Heidi Plus — an enhancement to HEIDI, hence ‘Plus’. The key change being the delivery of data sets through a data explorer tool, along with a new layer of analyses and visualisations.
- Heidi Lab — an environment where teams, from across higher education, can work together to solve problems not yet covered by Heidi Plus.
Heidi Lab is very difficult to conceptualise, without seeing the outputs, as it was as much about bringing people together as it was the development of new data visualisation dashboards.
What has been achieved?
First and foremost, Heidi Plus is live. It was launched on Monday 30 November 2015. It’s being used and HESA are in the process of managing the transfer of all UK higher education providers to the new system.
The team also ran a Business Intelligence Maturity survey, which received 50 responses and is available as a dashboard through the Business Intelligence project website.
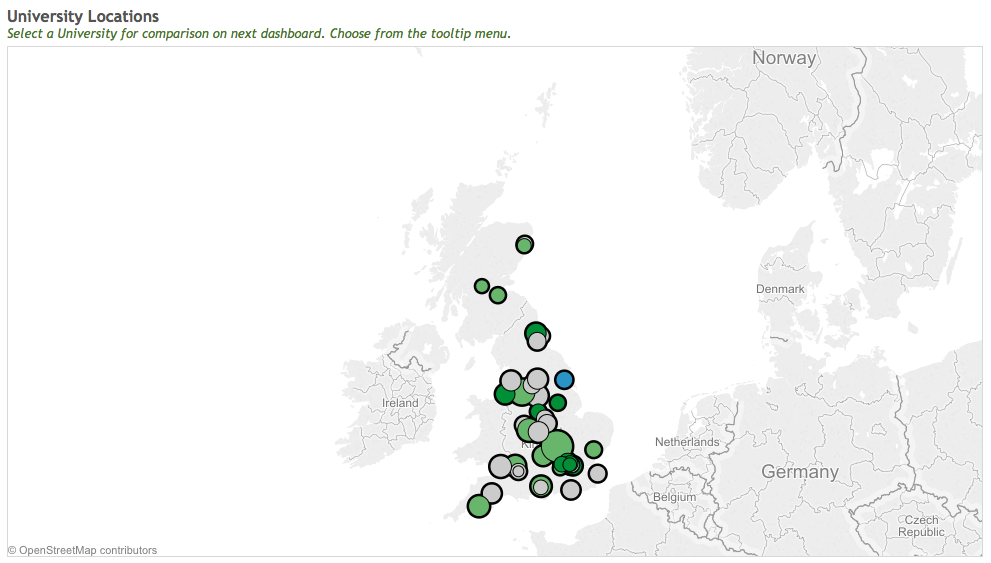
Heidi Lab completed today. There were two cycles of activity where teams came together to produce a range of dashboards. A Winter cycle comprising four teams that presented its outputs back in February, and a Spring cycle comprising five teams that presented its outputs today. The standard of those deliverables was outstanding, considering they were only aiming to develop ‘proof of concepts’. Outputs from the Winter Cycle are earmarked to be added into Heidi Lab, potentially by August, and I’m pretty certain many, if not all, the Spring dashboards will make it too. Examples of the kinds of dashboards that have been produced today include:
- A graduate destination dashboard
- An institutional staff/student diversity dashboard
- A widening participation dashboard
- A course provision dashboard
- A post-graduate research populations and funding dashboard
I’m going to go out on a limb here, perhaps my knowledge is limited, but I have a feeling the UK education sector might well be leading the way here in terms of a coordinated approach to business intelligence (I’d love to know if I’m wrong). And that is testament to the work of HESA, Jisc and the Higher Education Strategic Planners Association (HESPA) in bringing it all together.
Fantastic to see all the HE dashboards aimed for integration into HEIDIplus lots of hard work by the teams, it’s been a pleasure #hesajiscbi
— Stephen Little (@sg_little) June 30, 2016
What next?
Heidi Lab has run its course, however we are still riding the BI wave. We’re using a similar model to focus in on the library community. I should have said that the core audience thus far has been strategic planners. In this next phase we want to see what’s possible by mashing up some of the sector’s library data sets with existing data sets from elsewhere. And it doesn’t stop there with new developments in the pipeline, but more on that later :-)


 Tuesday, was predominantly preparation and travel. Off to Hull to support the University with it’s Learning and Teaching conference. I met the rest of the team in Hull where we ran through the activities for the day to make sure we were all on the same wavelength. All good, and so then it was a question of where to head for a quick drink and bite to eat. For some reason, the first reaction of most people when I said I was going to Hull was “rather you than me”. I’m not really sure why, because I’m glad to report we had a really nice meal in the Old Custom House, and an amazing pint in